Date Online: 2019-09-23
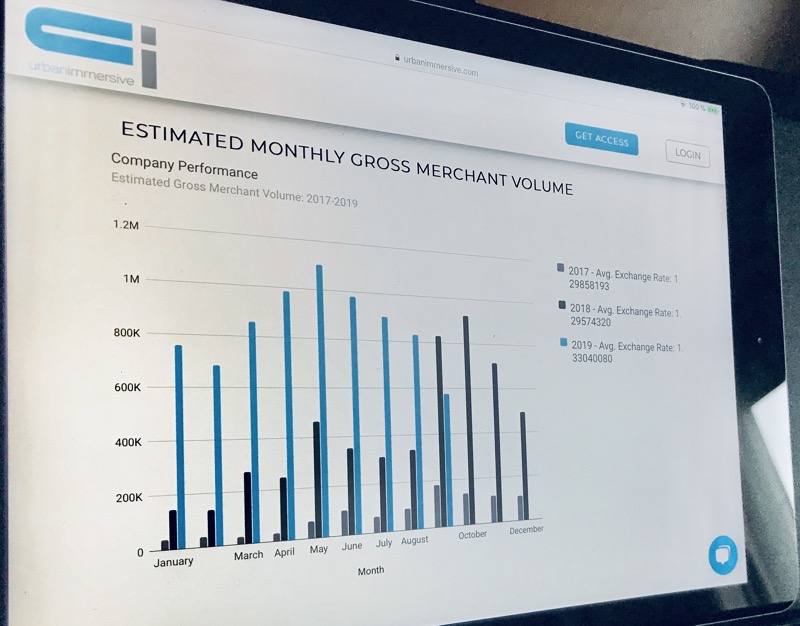
A lot has been said about the Gross Merchant Volume (“GMV”) metric shown on Urbanimmersive corporate website. Moreover recently since it appears the GMV Year-on-Year overlap is lower.
The company has received many investor questions on this metric, so we thought we would take a moment to clarify exactly how the GMV is measured as well as explain the main reason for the lower year over year overlap that is currently being shown.
GMV shows the total amount of payments processed by merchants (real estate photographers in our case) using UI’s business solution SaaS. Payment processes include the creation and collection of invoices as well as payment collections only (without having created the invoice within UI’s solution).
We’re considering payment processes within our solution as “mission critical" to our real estate photographer clients. Meaning, any downtime of our Saas can translate to merchants business activities downtime, particularly for merchants asking to get paid for their work on delivery.
Furthermore, merchants using our business solution for processing payments are less likely to switch to a competitive SaaS solution — and therefore increase their overall lifetime value for us. In other words, they are more likely to buy added value and productivity features that we offer them when they are using mission critical features.
GMV is therefore an important metric to follow. But…
While payment processes included in the GMV calculation are considered as mission critical feature, it is important to underline that payment processes feature are provided to merchants at no charge (part of the Free Business Solution). What this means is that merchants can use our SaaS solution to produce invoices and process online payments without contributing to UI’s top line revenues.
For better clarity, GMV doesn’t include our direct sale to merchants of added-value products such as single-website properties and video-rendering services which represent 90% of UI’s top line revenue or productivity features such as Media Delivery (think if it like a « Dropbox » feature) which represent alone, 10% of UI’s revenue.
Because GMV doesn’t include direct sales of added-value products and productivity features, this means, that in some cases, some merchants can largely contribute to the GMV numbers without contributing much or not at all to UI’s top line.
That was the case with former affiliate partners like ID3 Technology (announced in press release). While ID3 was contributing up to $1.5M in gross merchant volume*, they were only bringing roughly 25K a year of revenue for Urbanimmersive.
When we decided last year (as press released) to sunset our line of credit services offered to affiliates like ID3, some of them, including ID3, left our SaaS. The example of ID3 alone explains why the overlap of GMV from this year vs last year is much lower.
For Urbanimmersive, eliminating this low margin and high maintenance credit line services has since shown to be an excellent decision. While the decrease in GMV has been significant, the loss in top line revenue has been marginal. In other words, it had marginal effect on UI’s overall revenue, and in fact, greatly allowed us to produce significantly higher gross margins.
Investors concerned about the lower GMV overlap should be reminded of the impact this one-time product sunset had on it as well that while the GMV is a good metric showing market adoption for mission critical features, it has no true correlation to UI’s top line revenue has described in this post.
While our merchant adoption to our mission critical features continue to growth at a steady pace, UI’s GMV could increase without affecting the top line revenue and the reverse can also be true for reasons explained above.
*Note: ID3 sales were accounting for UI’s top line revenue when they were affiliated ( before the sunset in line of credit product offering). We’re now including former affiliate sales in the GMV graph for year-on-year comparison purposes only.